Finding Isolation in Philly's Bike Share System
Published October 20th, 2018 by Emily
Philly's bike share system, Indego, recently installed several new bike stations in the Navy Yard. This is a wonderful idea. Workplaces in the Navy Yard are between 15 and 35 minutes when walking from the last subway stop, so the three new Indego bikes stations bridge the gap. It's also a great way to quickly go to the nearby park or the nearest convenience store during the work day, when previously this trip would take much longer than a lunch break.
Looking at the map of the stations in Philadelphia, this creates an isolated group of bike stations and we haven't seen that before. There is a 1.5 mile gap between the Navy Yard group and the closest other station.
I imagined that most of the rides that were taken from one of the four stations in the Navy Yard group ended within that group, but I wanted to find out for sure.
Indego's ride data is publicly available on their website, so I tallied up top five most popular destination stations for each bike station. By determining how many rides from a station end up at its five most popular destinations I can tell how isolated a station is. If people generally only ride to those five stations rather than one of the other 130+, then there probably isn't easy access to the rest of the stations. To display this information in a single number, I created a metric called percent Isolation.
Percent Isolation = (total rides that ended at one of the top five destinations for that station)/(total number of rides that ended anywhere) * 100
This metric seemed to work very well, judging from the map below.
About half of the 130+ stations have a percent isolation of less than 30%. These stations tend to be concentrated in the heart of the network, in Center City.
There are a few stations on the outskirts of the center network, some around Fairmount Park in northwest Philadelphia that have a higher value, between 50 and 60% isolation. This makes sense, because, for example, the stations on the south side of Fairmount Park have only two or three stations within a mile of them.
This color-coding also points out stations that might not be obviously isolated. The station on the northeast side of the network at 6th and Berks would otherwise blend in as part of the network.
Possibly the biggest surprise of the map is station at 39th & Mt. Vernon. The station doesn't appear to actually be isolated with respect to location, so perhaps there is another reason.
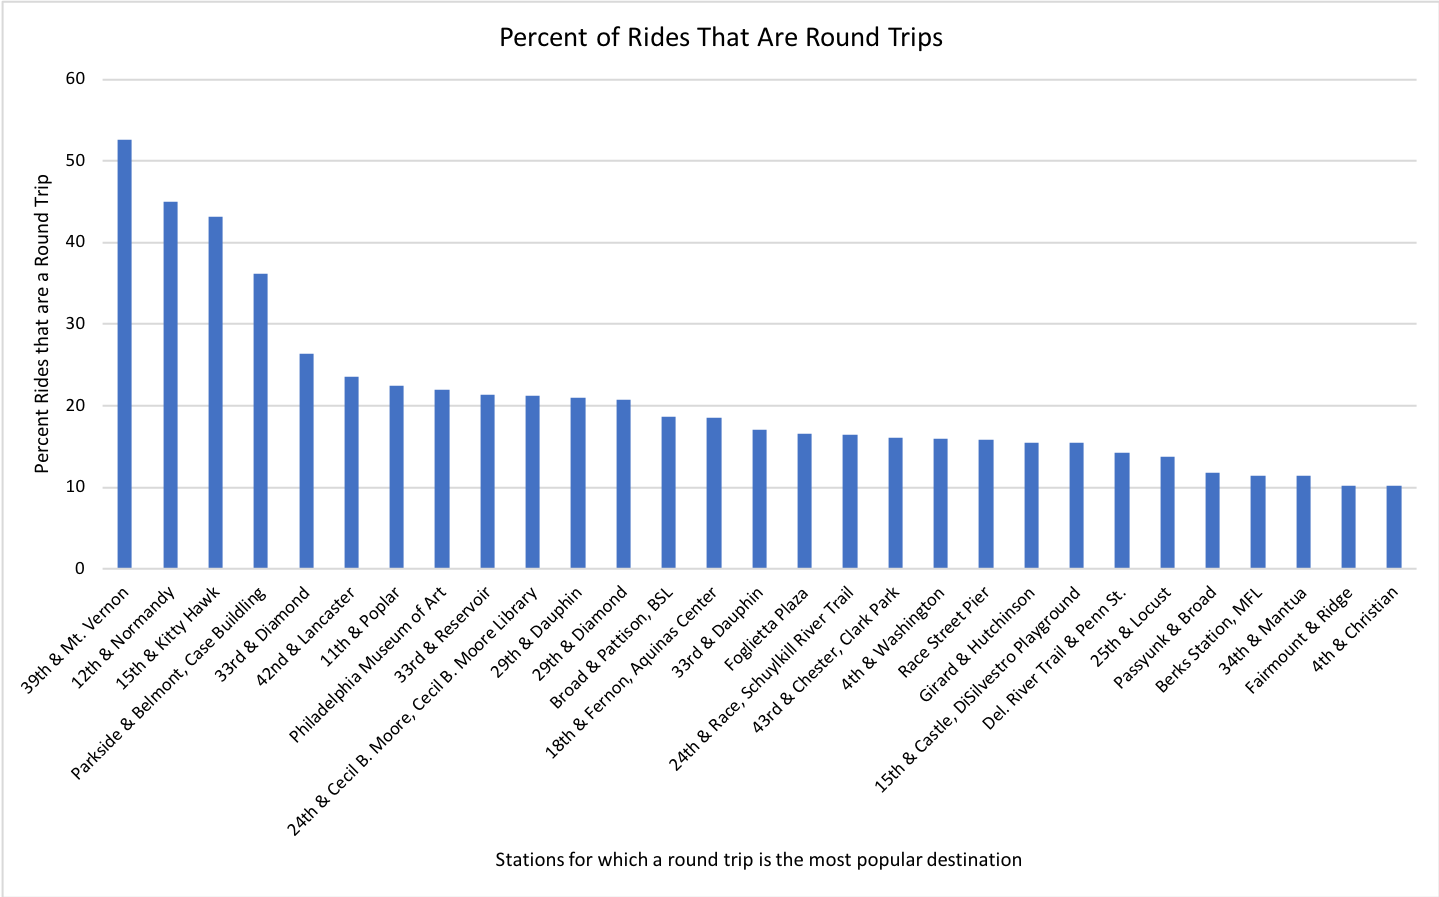
When I first looked at the data for this station, I noticed that the number one destination that people are riding to is this station. Indego calls this a "round trip". This is not uncommon, more than half of the stations have their most common destination being a round trip. However, this station has the highest share of round trips of any station in Philadelphia. Most people are checking a bike out, going for a ride, and then returning it to the same place.
To visualize how many people are taking round trips rather than one-way trips to another destination, I made the following chart.

Looking at the chart it is clear that there are four stations that have a higher rate of round trips than the others. 39th & Mt. Vernon is the highest, followed by two stations that are in the Navy Yard, a location that is already incredibly isolated. The last location is at Parkside & Belmont, which is right next to Fairmount Park. It is likely that people often use that station to ride around the park, which would be why there is a large amount of round trips.
However, why is 39th & Mt. Vernon so isolated? The station is next to a community center, so I wondered if Indego had held a promotional event where they offered free rides from one location to another. However, looking at the number of rides per day and the number of round trip rides per day I could find no spikes so this is likely not the case. The station averages about 4 rides every day, and 2 of those are likely to be round trips.
In the future I will do some more analysis of the Navy Yard, including finding out how many people participated in Indego's Bike To Work Day event in the Navy Yard. I will also fix the map so that it shows all the colors on the legend.