Megabus Ticket Price Analysis
Published August 17th, 2018 by Emily
Using Python, BeautifulSoup, and Urllib2 I scraped ticket price information from a specific Megabus route for the upcoming 60 days.
Weekends vs. Weekdays
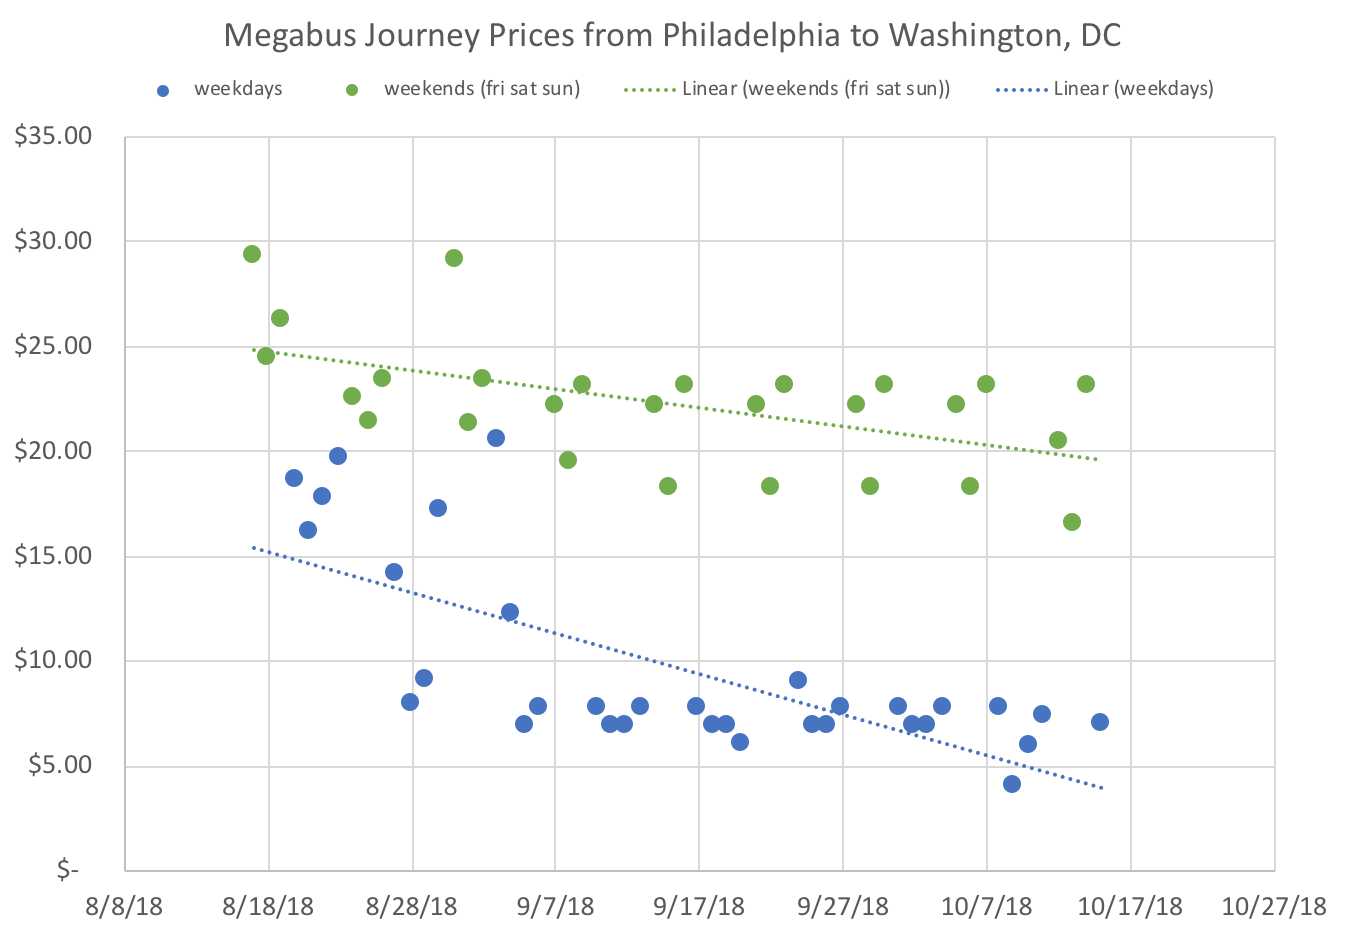
When I plotted the average ticket price for each day there was a clear difference between "weekdays" and "weekends".
Average Ticket Price
| Weekends | Fri-Sun | $22.24 |
| Weekdays | Mon-Thurs | $9.57 |
I highlighted weekends in green to differentiate from the blue weekdays.

There are two outliers in the next few weeks, on Friday, 8/31, and Monday, 9/3. These higher ticket prices coincide with the holiday weekend, Labor Day.
Weekly Pattern
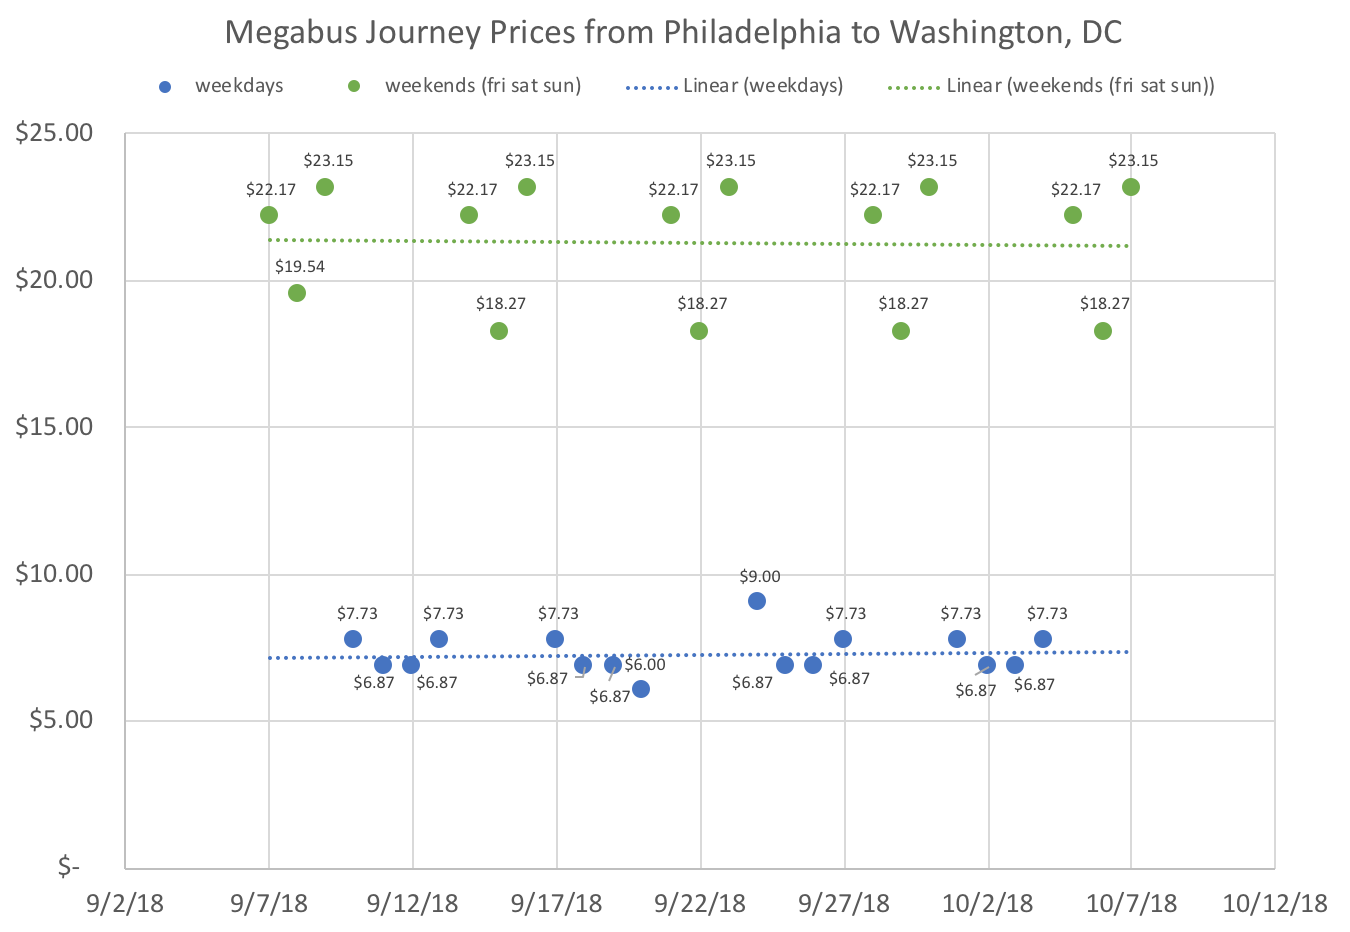
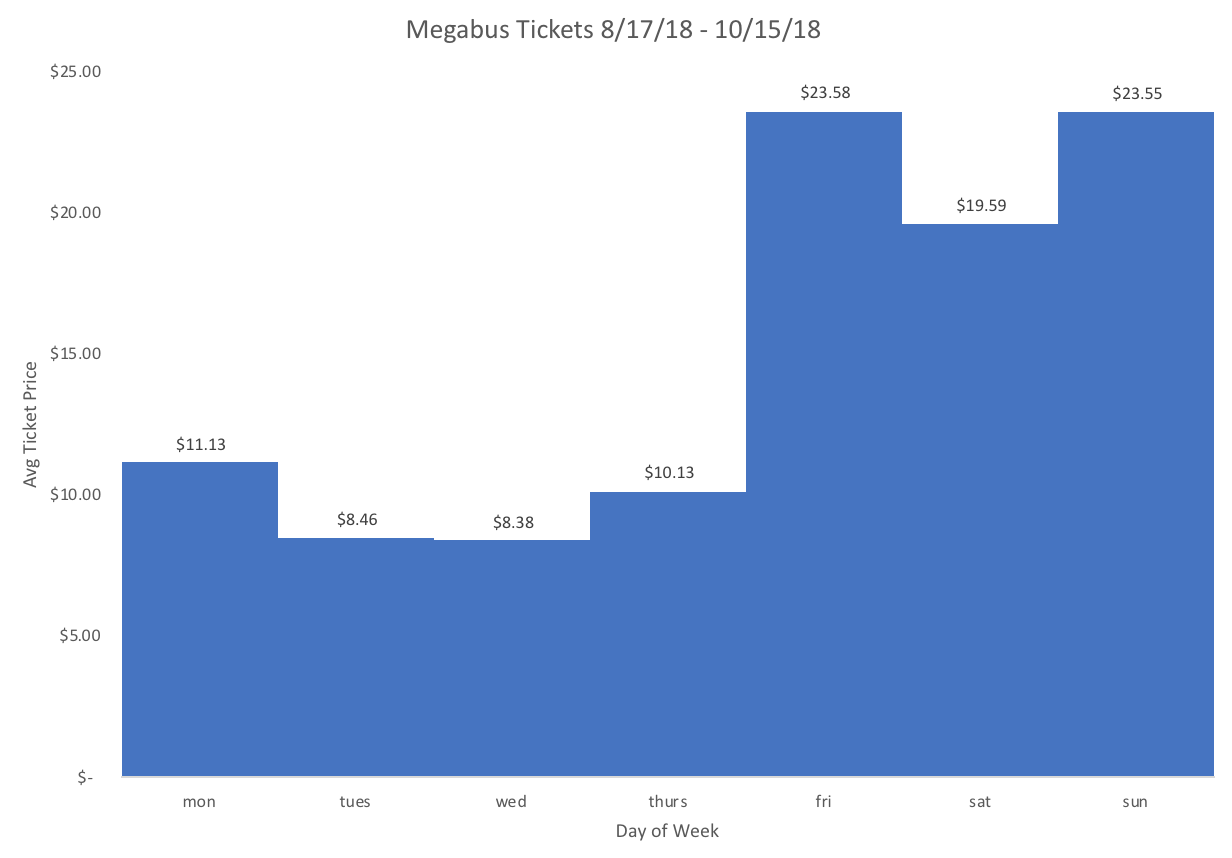
Looking at the weeks between 9/7 and 10/7, a pattern for the week emerges. Sunday is the most expensive journey of the entire week followed closely by Friday.

I am presuming that because these weeks are so uniform and they are about two weeks out from when I collected this data, that these are the "standard" prices that the pricing algorithm starts out with when there isn't a high demand for tickets. The only outliers seem to be on the weekend of 9/20 - 9/24. I'm not sure why the Thursday and Monday tickets are priced differently when the weekend tickets are priced the same as normal.
Overall Trends
Although I think that the algorithm starts out with Sunday being the most expensive day, over the entire 60 days of data that I collected, it seems that Friday is slightly more expensive. This may be due to the decreased price of the Sunday tickets on Labor Day weekend.

Future Plans
Later I plan to automate this script to repeat this several times a day so that I can see how the listed prices might change over time.
Update: I collected data for many, many days, however it was beyond my data processing abilities to make sense of it. If anyone wants the data, please contact me at emily at boda dot codes.